
THE FUTURE OF WEALTH
Investing With Strength
Learn how our Relative Strength strategy can help you understand your place in the investing landscape.

HOW WE INVEST
Our Investment Approach
You wouldn't trust your future to something untested, so neither did we. For over 20 years, we've researched and tested the Relative Strength strategy we offer our clients.
LEAD BY WHAT YOU BELIEVE
Our Guiding Principles
Without a core set of principles, success is always in doubt. That’s why at Avalon, we stick to a core set of 6 investing principles that yield consistent results for our clients.
Schedule a FREE Advisor Consultation
We're currently accepting clients with portfolios valued at $1 million+ (or $200,000+ if you have an advisor). Contact us today to find out more.
How We Invest
Relative Strength is the cornerstone of our investment process.
“Relative Strength” speaks to the “strength” of one security “relative” to another. If Security A advances by more than Security B, then it’s showing positive Relative Strength. If Security A declines, but by less than security B, it’s still showing positive Relative Strength.
For example, both the Energy and Consumer Staples sectors outperformed the S&P 500 in 2022 and would have made for better investment choices providing superior returns.

It’s important to understand that we use Relative Strength to reduce the risk of loss, as well as increase our upside potential. Weak sectors lag in rising markets and tend to lose more in falling markets. Weak sectors, once identified, should be avoided or only considered for short positions.
In this example, Staples were down about 7%. Relative Strength would still help you save money in this down market though, as Staples were stronger than the S&P 500 on a Relative Strength basis (Staples was down 7% while the S&P was down almost 19%).
As Charles Dow, the first Editor-in-Chief of the Wall Street Journal once said, “Sell your losers early and let the winners run.”
Successful investors know that in order to succeed, they must clearly see what is really happening in any market.
To do that, you need a process that allows you to see what other investors can’t – that’s your edge. Successful investors know to track the “smart money.” It’s institutional money (with hundreds of millions of dollars to invest) that is responsible for changes in the market. It’s institutional money that drives supply or demand for a security, and therefore price.
 We all understand the basic forces of supply and demand. As demand for a product or service increases, so too does its price. Conversely, more supply for particular goods than interested buyers results in falling prices.
The same laws of supply and demand are what ultimately drive the prices of any market, sector, or security. Once understood, successful investing becomes a matter of finding a strategy that exploits this relationship… and that’s where Avalon shines the brightest.
We use a proprietary investment process based on complex algorithms to break down markets into supply and demand relationships that allow us to clearly see where institutions are investing and where they’re not.
It’s all about finding that price trend and riding it until our research and indicators tell us otherwise.
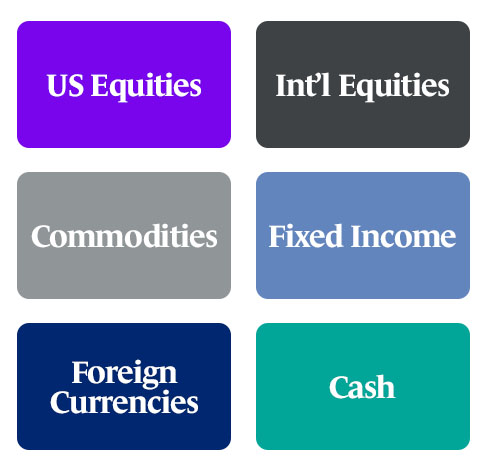
We take a top-down approach.
Meaning we first analyze each market’s strength against every other market – using algorithms to mathematically rank each market against the other. This guides the investment process as we can quickly see which of the six markets is strongest and deserves investment capital, and which markets are the weakest and should be avoided.
The next step in our process is to drill down deeper into each market and determine the strongest sector within each market. The graphic below compares the absolute performance of different industry groups (sectors) within the U.S. Equity Market vs. the S&P 500 Index.


The sector quilt above provides sector and market performance (SPY) from 2007 - through January 2022. The black box represents the performance of the S&P, while each sector is represented by miscellaneous colors. As you can clearly see, the black box representing the S&P 500 Index usually resides in the middle of the pack.
The reason for this is that the S&P 500 is comprised of all 10 sectors making up the U.S. equity market – therefore the S&P 500 is considered an “average” (although unequal) and its returns generally reflect that.
The old adage that a rising tide lifts all boats isn’t universal. Take 2007 for example; while Energy and Basic Materials earned 35.34% and 19.79%, respectively, the Healthcare and Financial sectors lost more than 20%, as the S&P 500 barely kept afloat, earning just 3.53%.
According to a study provided by our friends at Dorsey Wright & Associates, the average differential between the best-performing sector and the worst is staggering…

Consider that in multiple years and you can imagine the impact choosing the best sectors can have on your future wealth.
Still not convinced?
Below is a simple study illustrating the impact on a $100,000 investment made to the strongest asset class, the two top asset classes, owning all six major asset classes, and the results of being unlucky enough to own the weakest asset classes. The results are impressive.

Schedule a FREE Advisor Consultation
We're currently accepting clients with portfolios valued at $1 million+ (or $200,000+ if you have an advisor). Contact us today to find out more.

Get Our FREE Guide
How to Find the Best Advisor for You
Learn how to choose an advisor that has your best interests in mind. You'll also be subscribed to ADAPT, Avalon’s free newsletter with updates on our strongest performing investment models and market insights from a responsible money management perspective.
